How to Optimize Animated Ads for Better ROAS: A Data-Driven Framework
Driving ROAS with animated ads requires more than strong visuals; it demands a rigorous framework for creative testing, precise measurement, and iterative learning loops.

Sections
Animated advertisements effectively capture user attention in crowded feeds, but translating that attention into Return on Ad Spend (ROAS) requires a systematic approach to creative strategy and measurement. High-performing campaigns rely on fast learning loops where variables are isolated, tested, and iterated upon based on data rather than intuition.

Core Creative Principles for Performance
To move beyond simple engagement and drive conversions, animated creatives must adhere to strict structural principles. The visual hierarchy should prioritize the product, followed by the benefit, and finally the call to action (CTA), ensuring the message is clear even without sound.
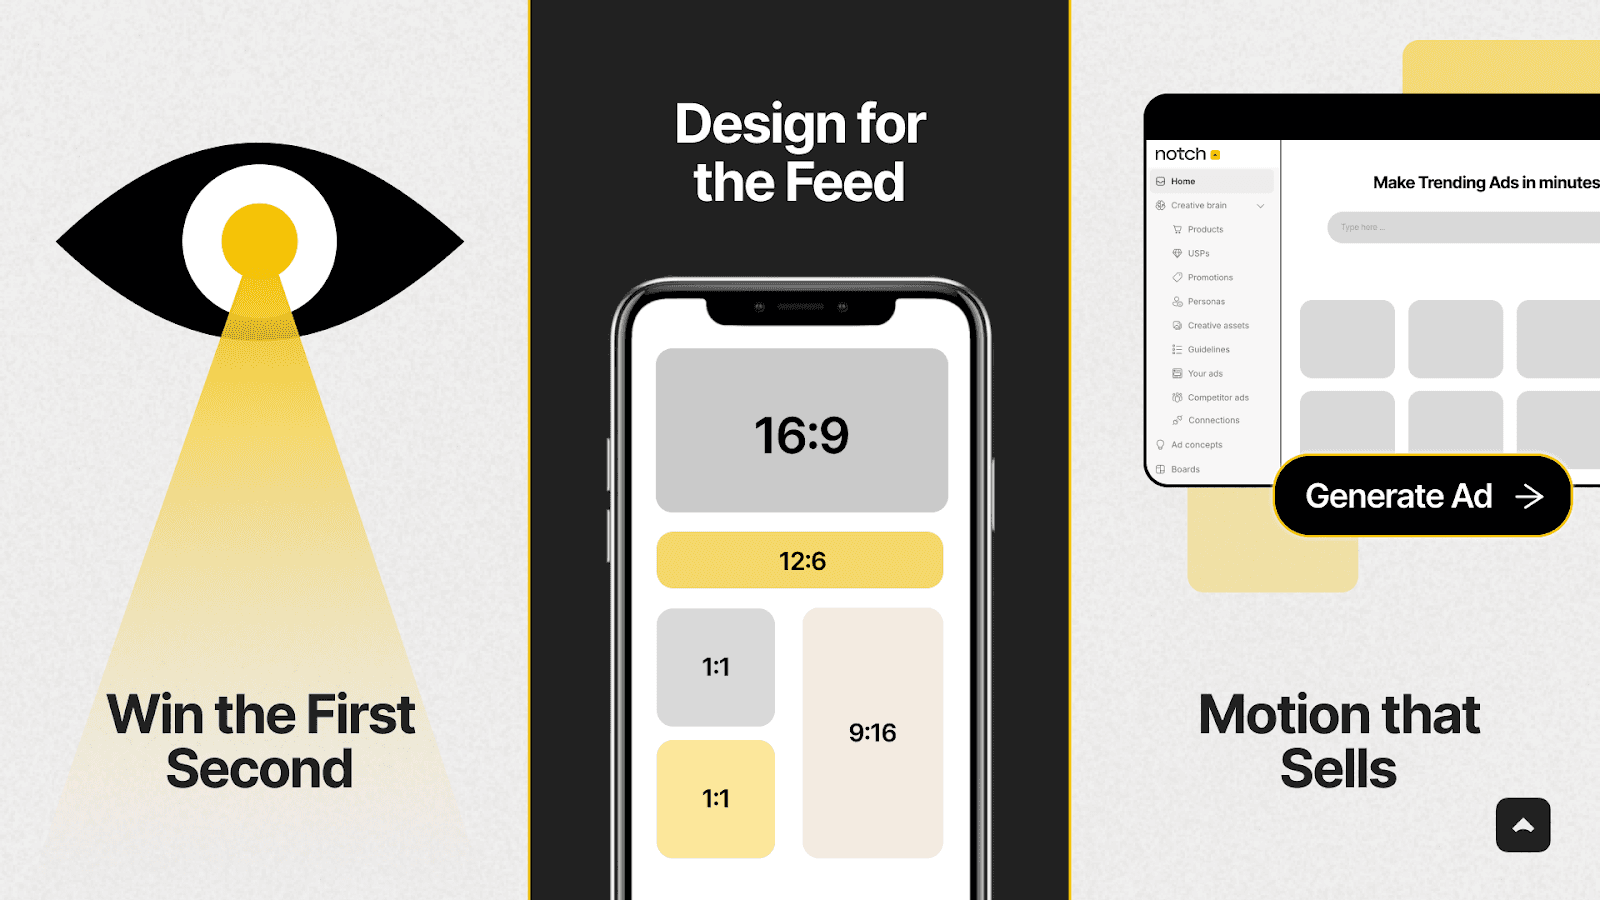
The First Second Criticality
Viewer retention is determined almost instantly. Effective ads often employ motion cues such as whip-pans, scaling effects, or rapid swipes to create immediate visual contrast. A key benchmark is displaying the primary value proposition text on-screen by the 0:01 mark, supported by captions for muted viewing.

Feed-First Design Standards
Unlike traditional storyboarding, feed-based design must account for rapid scrolling behaviors on mobile devices. Essential elements must remain within safe zones to avoid cropping across different placements.
- Aspect Ratios: Assets should be produced in 1:1, 4:5, and 9:16 formats to cover all inventory types.
- Legibility: Text overlays should be limited to 3–5 words per frame with high-contrast colors.
- Pacing: Maintain a tempo of 0.6 to 1.0 seconds per beat to keep momentum without causing disorientation.
Structuring Motion for Conversion
Motion in performance marketing serves a functional purpose: communicating value. Rather than decorative animation, successful ads often use a progressive reveal structure. This sequence typically introduces a problem, demonstrates the solution through product action, and concludes with proof points like user ratings or trusted logos.
Micro-animations—such as ticking counters or pulsing stars—can subtly highlight social proof elements without cluttering the frame. However, offer details and legal copy must remain static long enough to be readable.
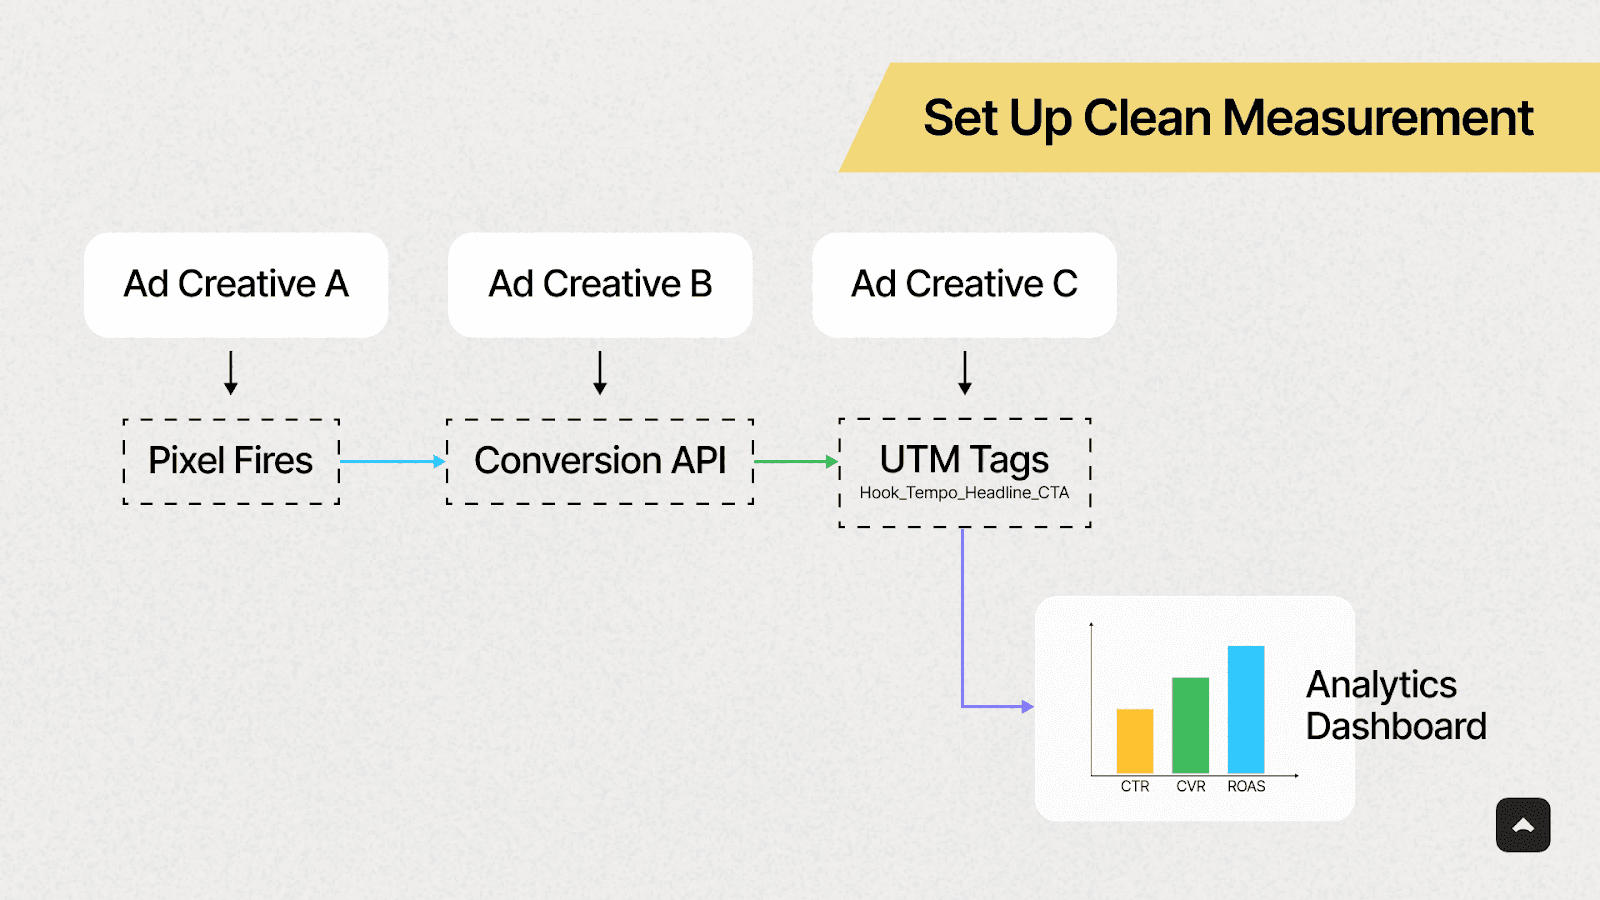
Measurement and Variable Isolation
Accurate data collection is the foundation of optimization. A robust measurement framework aligns conversion events with specific creative variables, allowing marketers to attribute performance to specific elements like the hook, tempo, or headline.
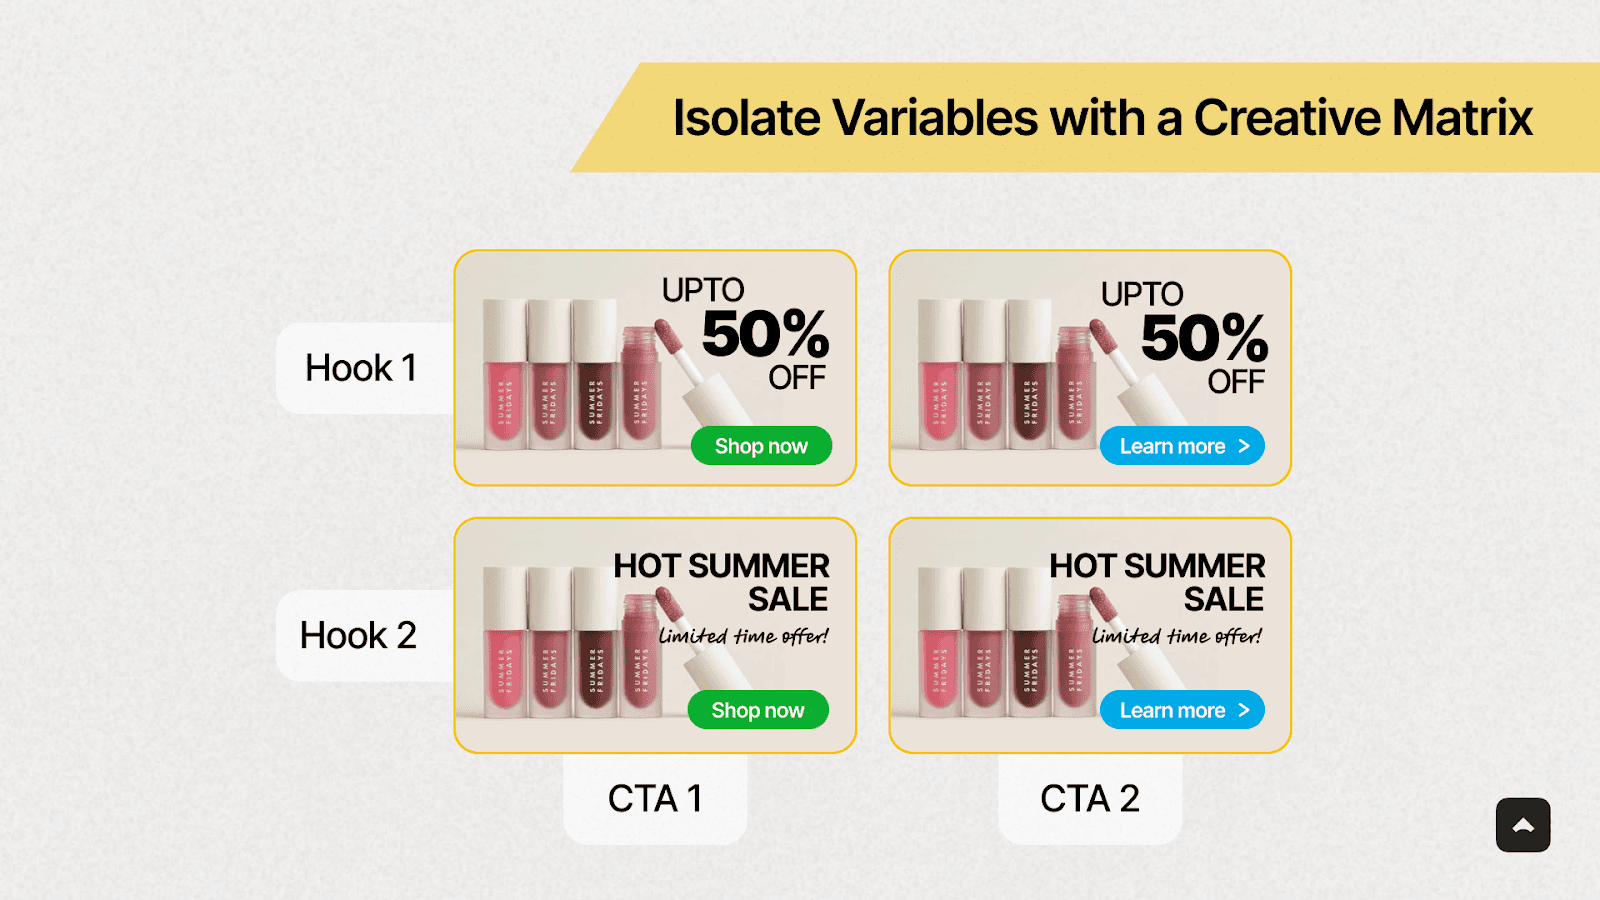
The Creative Matrix Approach
To understand what drives performance, variables must be tested in isolation. A creative matrix systematically varies one component—such as the opening frame or CTA style—while keeping others constant. This prevents confounded results where the driver of success is unclear.
- TikTok: Favors native-style transitions and lo-fi aesthetics.
- Meta: Rewards immediate clarity and high-fidelity visuals in the first frame.
- YouTube Shorts: Relies heavily on bold subtitles for retention.
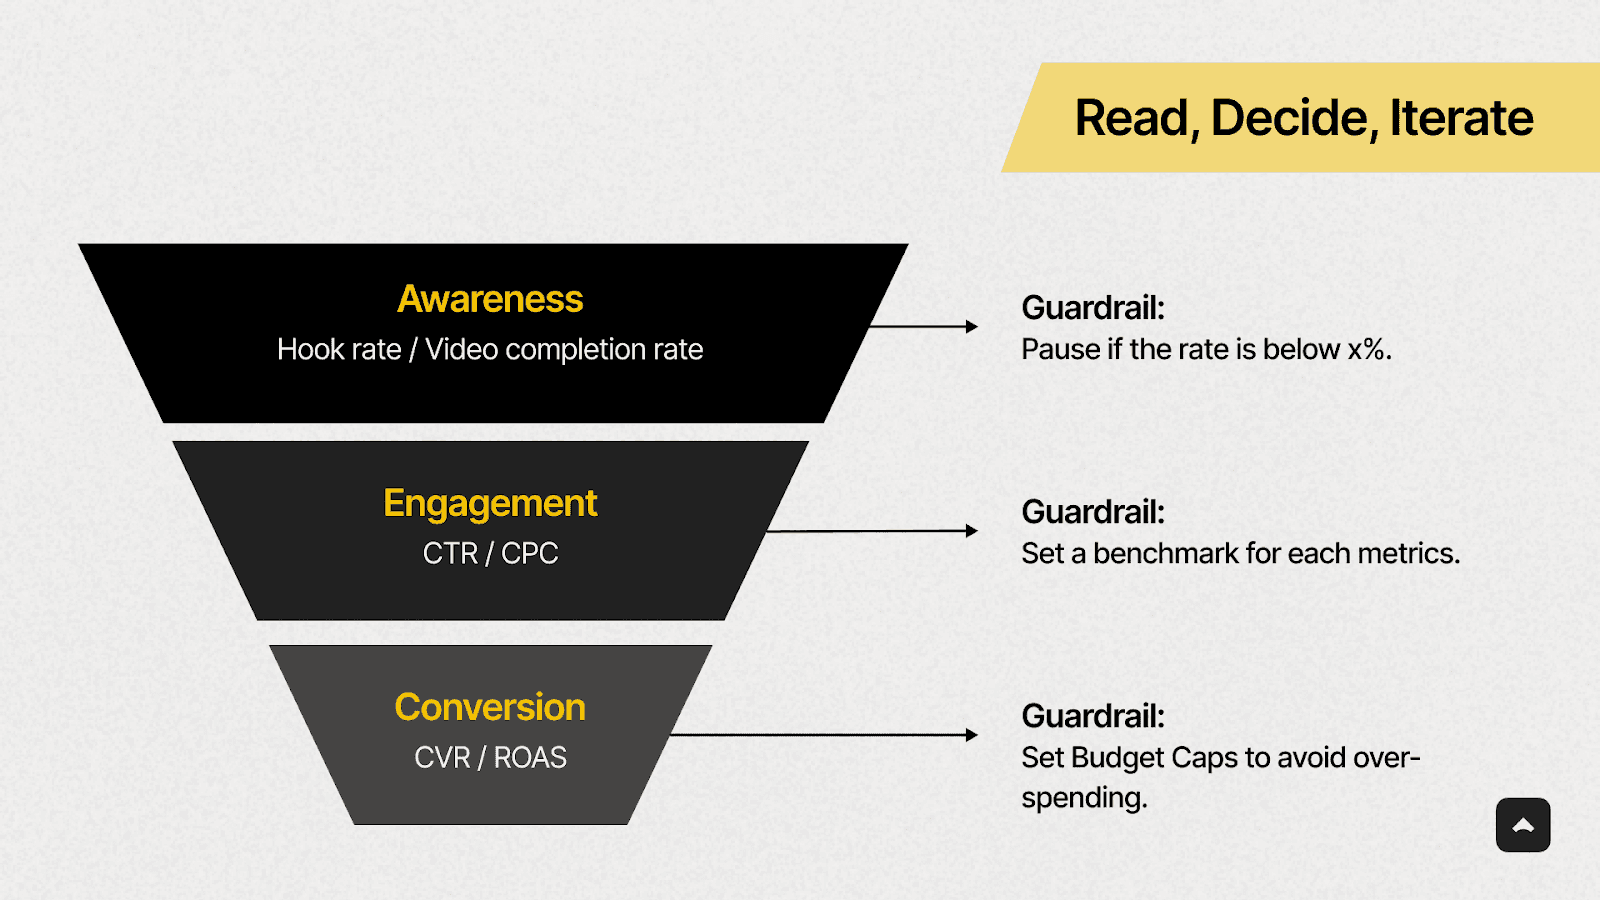
Analyzing Funnel Metrics
Interpreting results requires mapping metrics to the funnel stage. Upper-funnel performance is gauged by hook rate (3-second views / impressions) and video completion rates (aiming for 25–50%). Mid-to-lower funnel success is measured via CTR, CPA, and ROAS.
 ROAS"
data-placeholder="funnel-metrics-analysis.webp"
loading="lazy"
/>
ROAS"
data-placeholder="funnel-metrics-analysis.webp"
loading="lazy"
/>
Guardrails should be established to pause assets that fall below specific CTR benchmarks early in the spend window. Winners are optimized through small, deliberate iterations rather than wholesale redesigns.
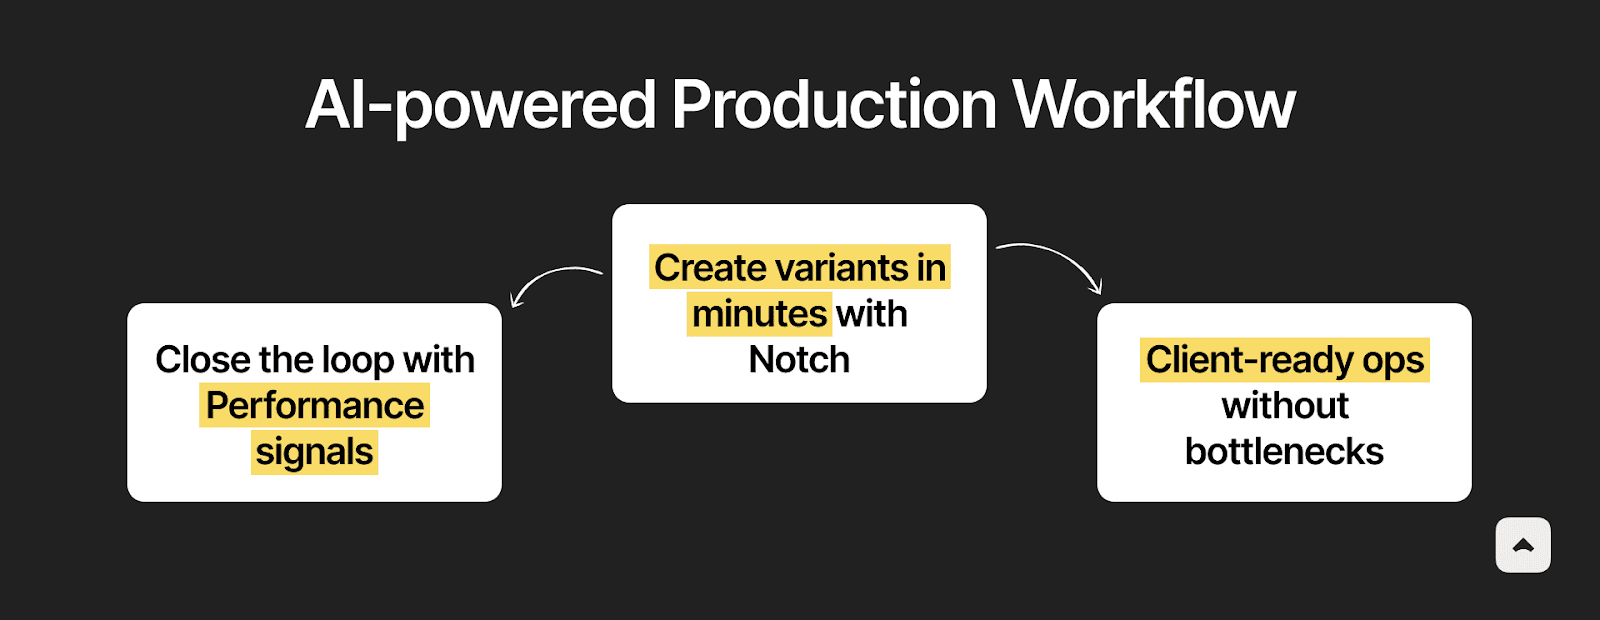
Practical Workflow: optimizing Animated Ads
Implementing a data-driven creative process requires a disciplined workflow that connects production to performance analysis.
- Step 1: Standardize Measurement Naming
Define a consistent UTM structure (e.g., Hook_Tempo_Headline_CTA) to ensure granular tracking in analytics platforms. - Step 2: Construct the Creative Matrix
Select one primary variable to test (e.g., three different opening hooks) and keep all other elements identical across variants. - Step 3: Batch Production
Generate all necessary aspect ratios (1:1, 4:5, 9:16) for each variant simultaneously to ensure consistency and reduce manual rework. - Step 4: Launch and Segment
Deploy variants to separate ad sets or use dynamic creative testing tools, ensuring budgets are sufficient for statistical significance. - Step 5: Review Signal Data
Analyze performance after the initial learning phase, identifying "winner" and "loser" tags for specific variables. - Step 6: Iterative Refinement
Use data prompts to generate the next round of creatives (e.g., "keep winning hook, increase tempo") rather than starting from scratch.
Common Mistakes in Animated Ad Strategy
Even with good intentions, campaigns often fail due to structural or process errors. Avoiding these pitfalls protects budget efficiency.
- Testing Too Many Variables: changing the hook, music, and CTA simultaneously makes it impossible to know which change caused the performance shift.
- Ignoring Safe Zones: Placing critical text or logos at the very edges of the frame often leads to cropping on specific mobile devices.
- Slow Pacing: Beats longer than one second can cause drop-off in fast-scrolling feeds; momentum is essential.
- Data Gaps: Failing to verify pixel firing or Conversion API setups leads to incomplete attribution and misguided decisions.
- Visual Clutter: Overloading a single frame with multiple messages dilutes the primary value proposition and confuses the viewer.
Frequently Asked Questions
What is a good benchmark for hook rate?
A healthy hook rate (3-second views divided by impressions) typically falls between 25% and 35% for animated ads. Rates below this suggest the opening visual or copy needs immediate revision to better arrest the scroll.
How many variants should be in a single test?
To maintain statistical validity without diluting budget, limit tests to 2–3 variants per variable within a matrix cell. This ensures each asset receives enough spend to generate actionable performance data.
How often should creatives be rotated?
Creative fatigue varies by platform and spend, but a weekly rotation or refresh cycle is common practice. Monitor frequency metrics and CTR decay to determine exactly when a specific asset has saturated its audience.